Performance
AI Recommendations Performance
AI statistics give us an insight into how the AI performs and the parameters that influence the recommendations displayed. We can see various metrics, including the number of generated recommendations and the effectiveness of recommendations across different pages.
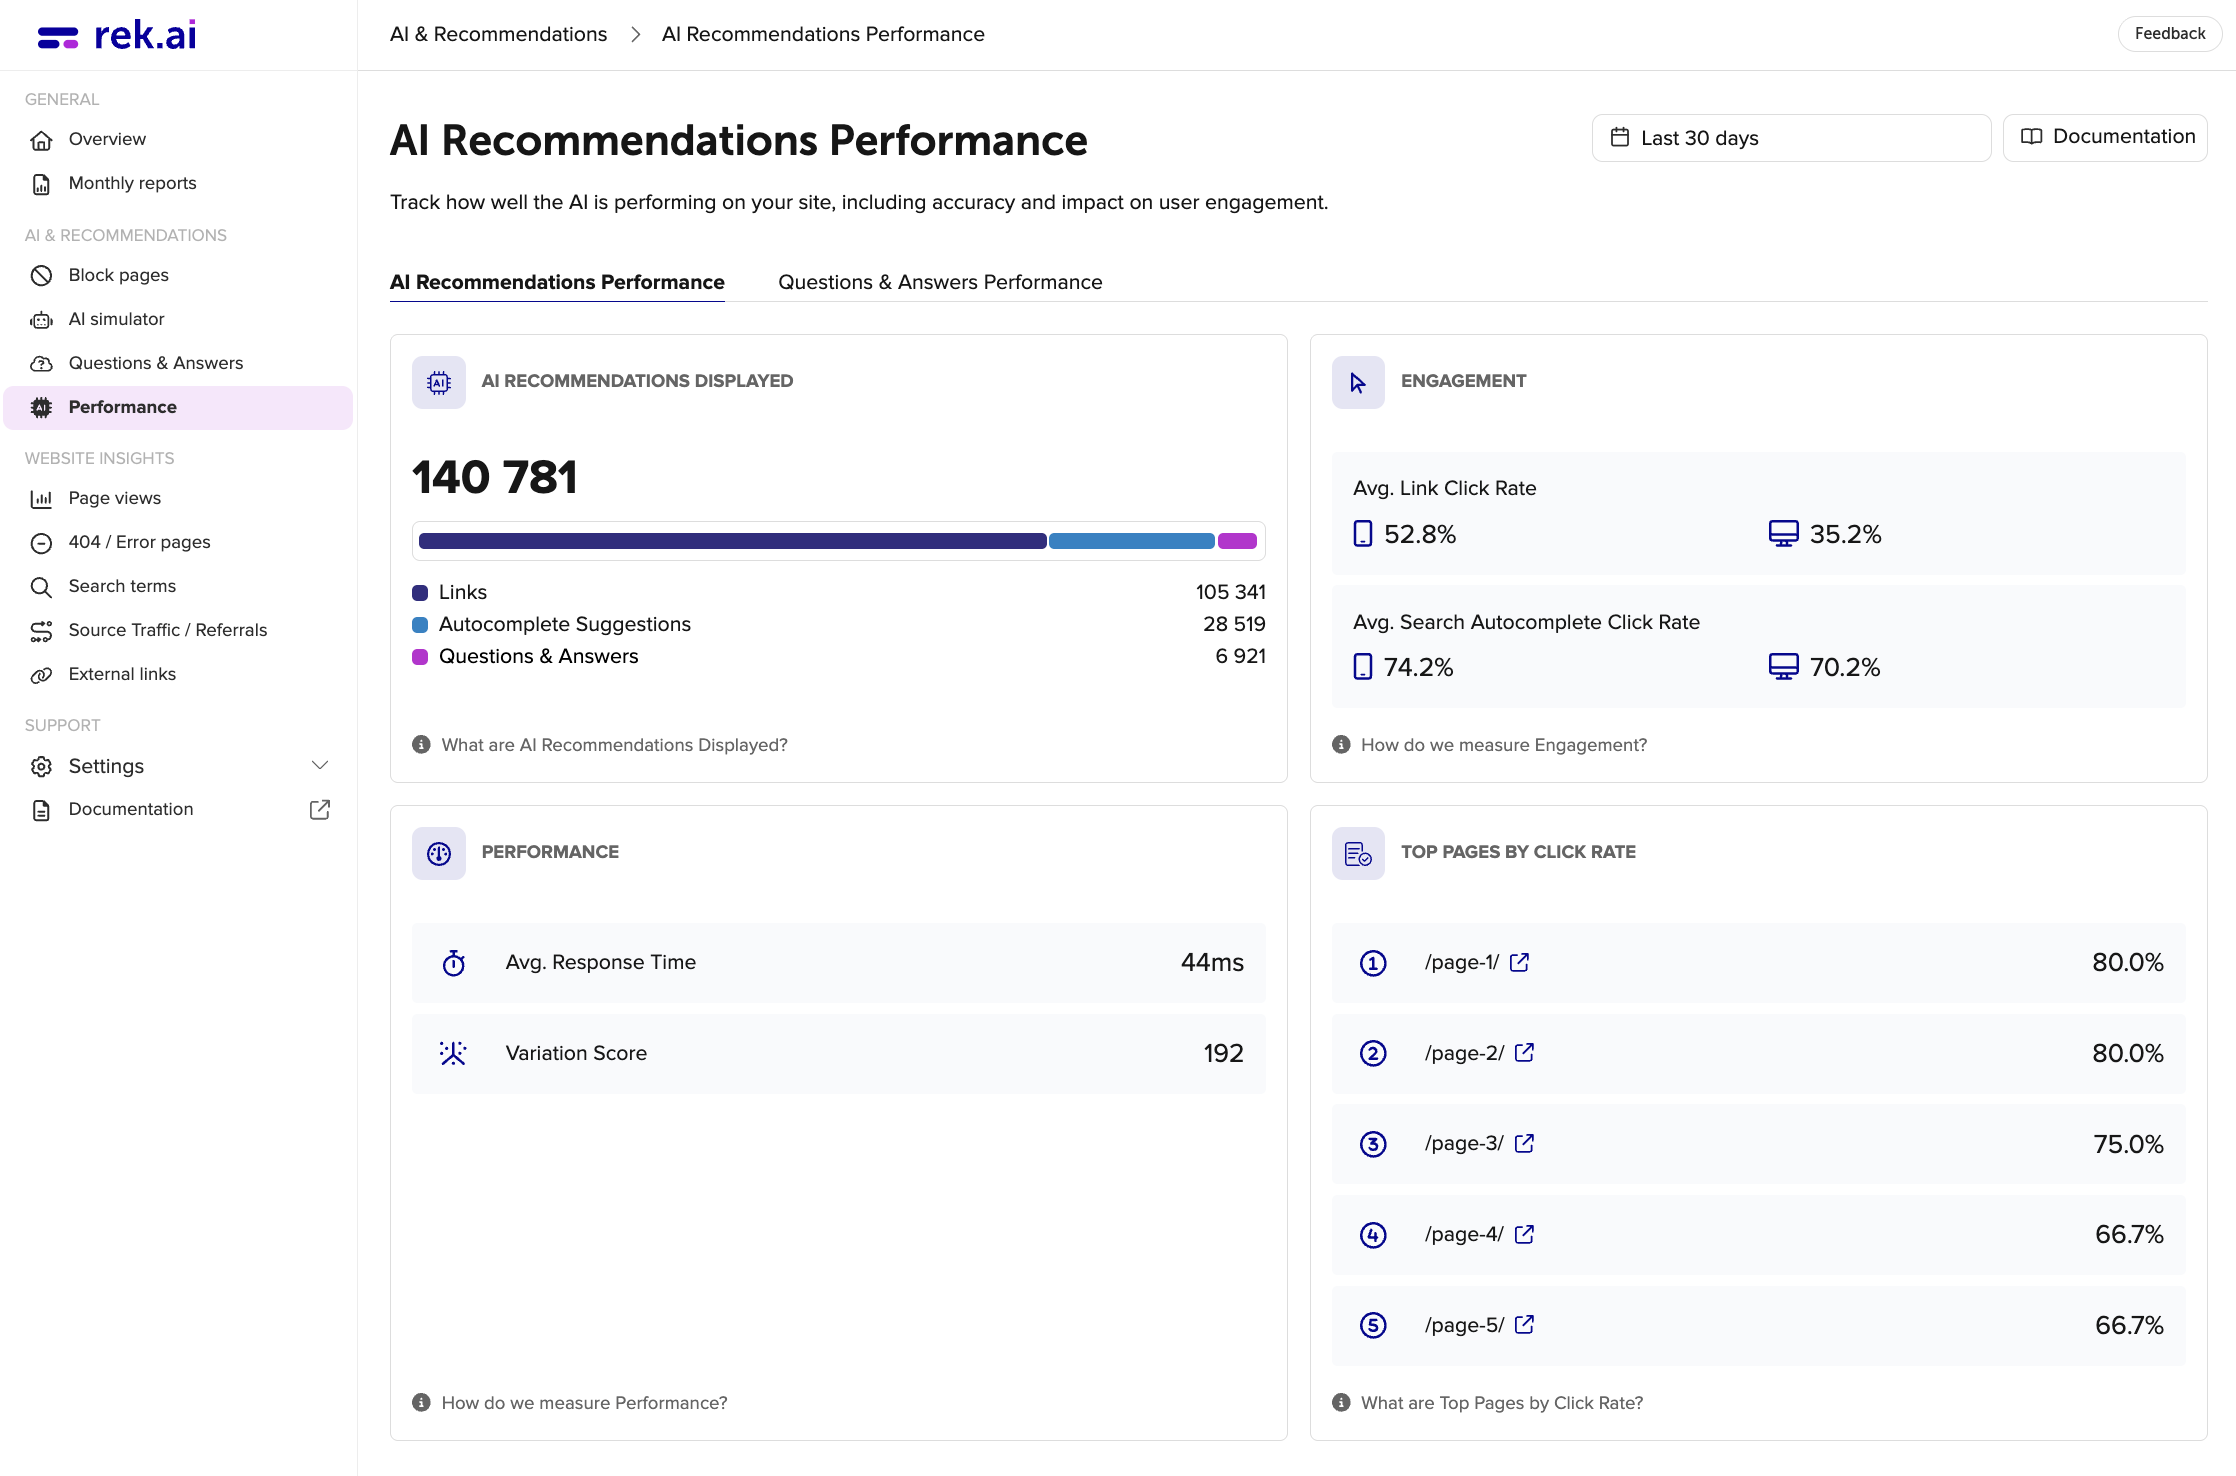
AI Recommendations Displayed
This metric indicates how many instances of recommendations have been generated. For instance, if a news article displays 3 recommendations at the bottom of the page, it counts as one recommendation. The figures presented are divided into:
- Links
- Autocomplete Suggestions
- Questions & Answers
Engagement
This metric represents the proportion, expressed as a percentage, of visitors who engaged with the displayed recommendations or autocomplete suggestions by clicking on them.
One engagement is defined as when a user has a link recommendation or search recommendation in the viewport for 1 second and then interacts with them.
-
Avg. Link Click Rate - The numbers are broken down by desktop and mobile. The percentage is an average of all pages on the website that present recommendations. This is to equalize the differences between how the recommendations are presented on different pages.
-
Avg. Search Autocomplete Click Rate - The numbers are broken down by desktop and mobile. The percentage of the users that gets an autocomplete suggestion and clicks on it. So if a user press enter or leaves the searchfield without clicking on the suggestion, it is not counted as an engagement.
Performance
- Avg. Response Time - This metric, represented in milliseconds, signifies the duration of time taken for the recommendation to be processed on the server prior to being transmitted to the user.
- Variation Score - This metric provides insight into the diversity of recommended pages that visitors have engaged with. A higher value indicates a wider array of recommendations, showcasing their appeal to a diverse audience. In this context, it's evident that 293 unique pages have been recommended, highlighting the breadth of content offered to users.
Top Pages by Click Rate
Shows the 5 pages where visitors are most likely to click on a recommendation. The click rate is calculated as the number of clicks on recommendations divided by the number of times recommendations were shown on the page, expressed as a percentage. A high click rate means the recommendations on that page are well-matched to what visitors are looking for.
Questions & Answers Performance
Questions & Answers Performance provide insight into how the Questions & Answers feature performs and how visitors interact with the content displayed. The metrics include, the number of unique questions shown, percentage of questions opened and engagement levels across different pages and devices.
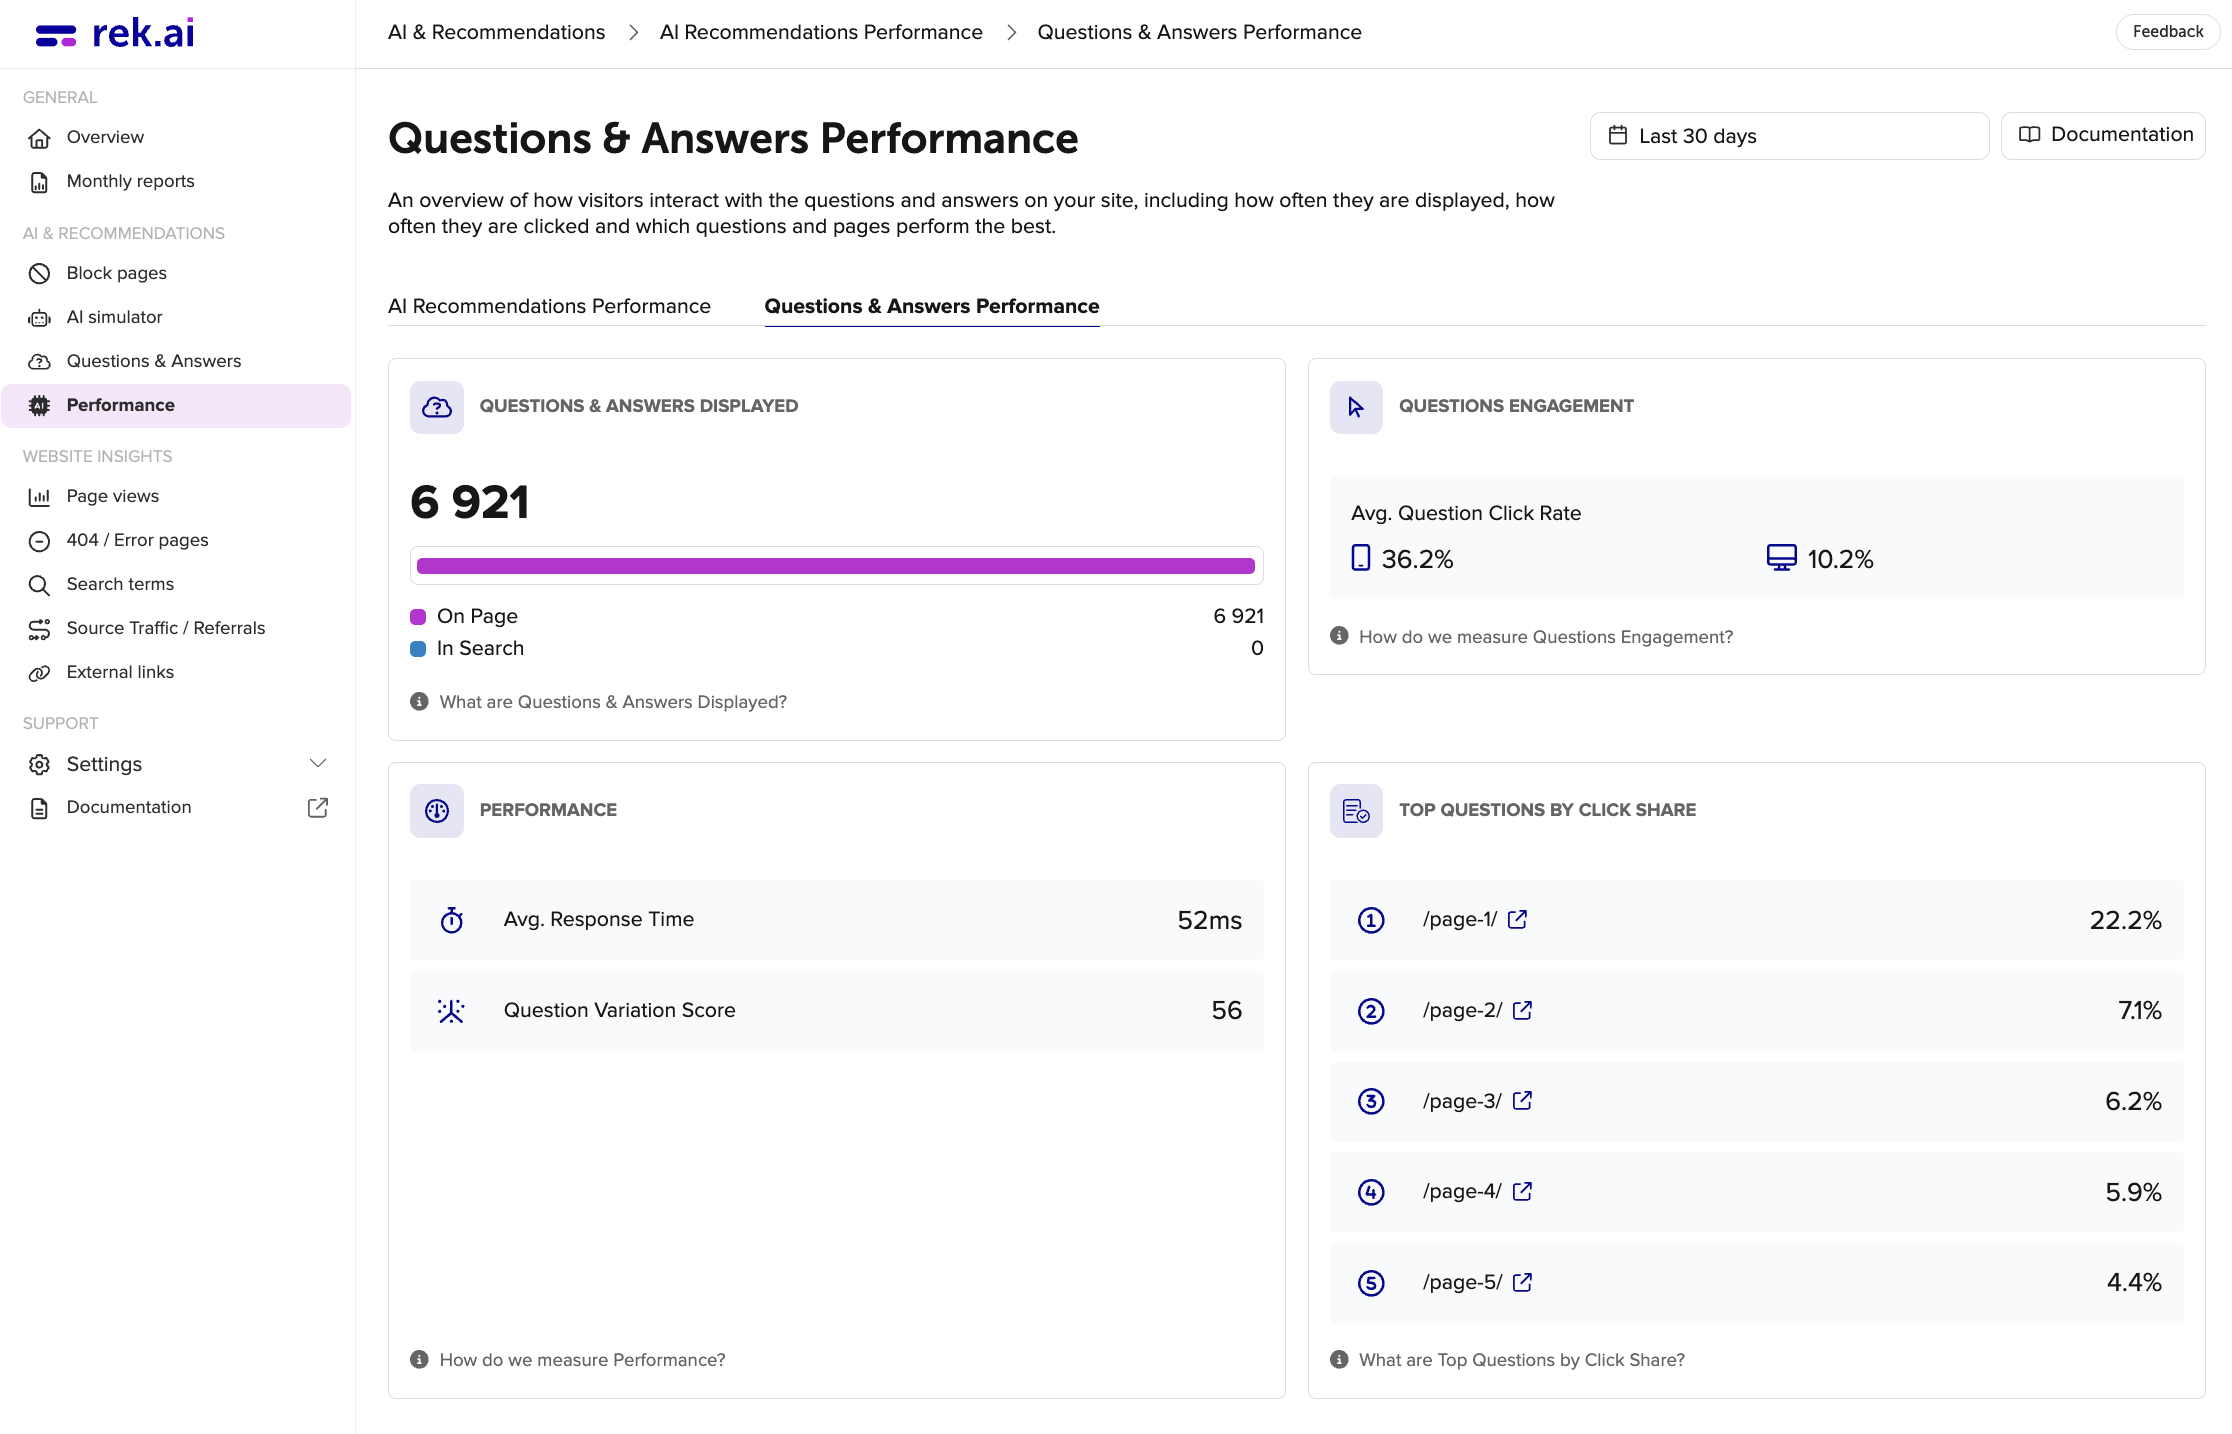
Questions & Answers Displayed
This metric indicates how many instances of Questions & Answers have been generated. For instance, if a target page displays 5 Questions and Answers at the bottom of the page, it counts as one recommendation. The figures presented are divided into:
- In Search
- On Page
Questions Engagement
Displays the average percentage of users who click to open a Question after it has been shown. The metric is segmented by device type, allowing comparison between mobile and desktop engagement rates.
Performance
- Avg. Response Time - This metric, represented in milliseconds, signifies the duration of time taken for the recommendation to be processed on the server prior to being transmitted to the user.
- Variation Score - This metric shows the number of unique questions that have been displayed to visitors. A higher value indicates that users have been exposed to a wider variety of questions across the site, rather than seeing the same questions repeatedly.
Top Questions by Click Share
Shows the 5 questions that receive the most clicks across the site. The percentage represents each question's share of all clicks on questions. For example, 25% means that one in four question clicks went to that question. A high click share indicates which topics visitors are most interested in.